
This tab will show you ALL activity on your Digital Edition, throughout ALL documents, for the date range selected.
Key Performance Indicators
Total Content Views Over Time
Readers by Device Type
Readers by Platform
Readers by Operating System
Readers by Region
Regions
Search Terms
Document Performance
Top Articles
Key Performance Indicators (KPIs)
In the KPI table, we break down the content by Articles, Pages, Other and All Content.
- Articles refer to the responsive articles, shown in Reading View.
- Pages refer to the physical pages digitized from your PDFs, shown in Page View.
- Other refers to all content that is not an article or page. For example, banner ads, TOC, Library page, etc.
- All Content will give you the total number for each column. Articles + Pages + Other will equal All Content for all columns, except for Unique Readers and Total Sessions.
The table below defines each metric within the KPI table on the Overview tab.
Definitions of KPI Metrics
| Metric | Definition | Calculation |
| Unique Readers | The number of unique readers that viewed a piece of content within the date range. A reader is determined to be unique based on cookies stored on their device. If possible, GTxcel will count a subscriber as one unique reader even if they access content from multiple different devices during the date range. | Unique ‘content viewed’ events |
| Total Views | The number of times a piece of content was viewed within the date range. A piece of content can be an article, a replica page, an interstitial advertisement, a table of contents, or a popup. | Total ‘content viewed’ events |
| Total Duration | The sum of the duration of all content views within the date range. | Total duration of ‘content viewed’ events |
| Total Sessions | The number of sessions that took place within the date range. A session is a group of interactions that take place within a period of time that starts when a reader views a piece of content and ends after 30 minutes of inactivity. | Total unique session IDs associated with at least one ‘content viewed’ event |
| Bounce Rate | The number of sessions that included only one content view as a percentage of all sessions during the date range. | (Total sessions containing just one content view / Total sessions) x 100 |
| Average Views per Reader | The average number of content views that each user viewed within the date range. | Total ‘content viewed’ events / Total Unique Readers |
| Average Duration per Reader | The average time that each user spent reading during the date range. | Total duration of ‘content viewed’ events / Total Unique Readers |
| Average Session Duration | The average duration of the all sessions that took place within the date range. | Total duration of ‘content viewed’ events / Total number of sessions |
| Shares | The number of times content was shared using the buttons provided during the date range. | Total ‘shared’ events |
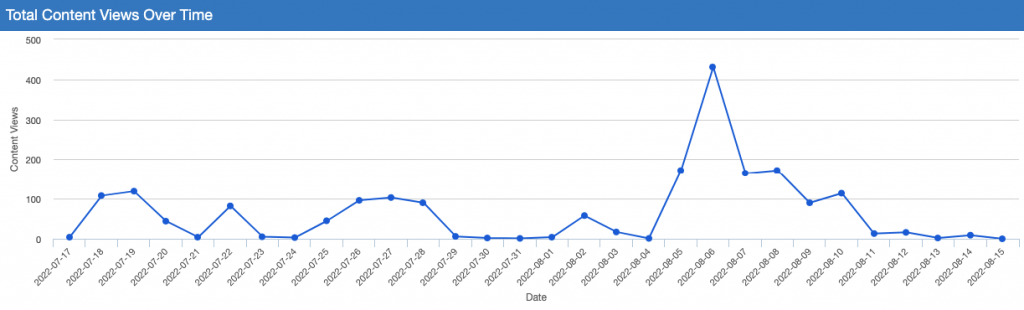
Total Content Views Over Time
This graph will give you an overview of reader usage over the date range selected.
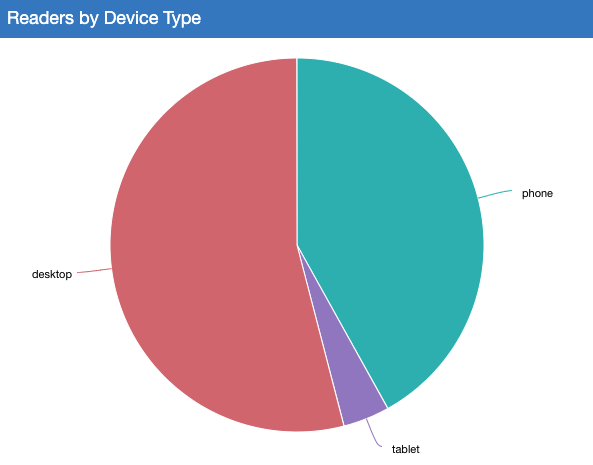
Readers by Device Type
This pie chart shows the device type (desktop, phone, tablet) that your readers are using to access your documents during the date range selected.
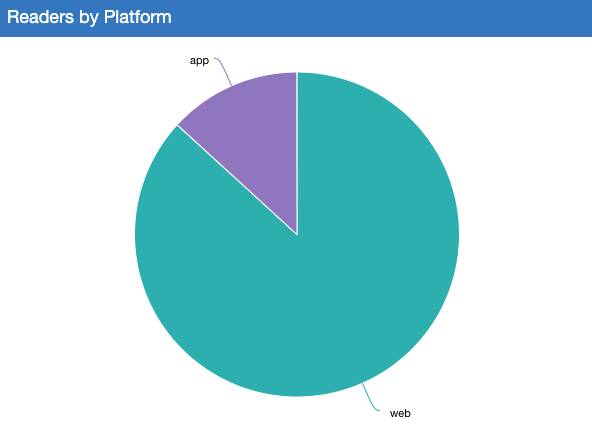
Readers by Platform
This pie chart shows the platform (web vs. app) that your readers are using to access your documents during the date range selected.
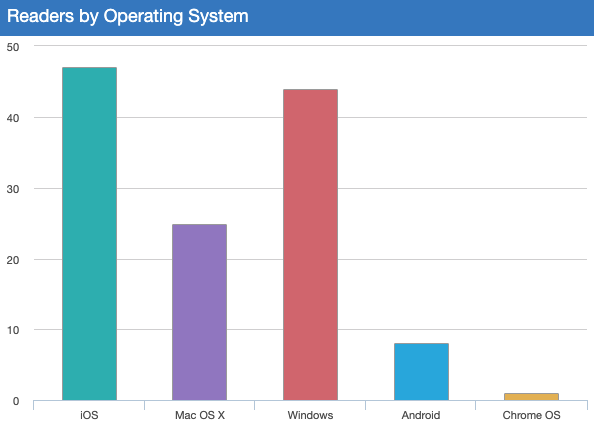
Readers by Operating System
This chart shows which operating system your readers are using when accessing your documents in the date range selected.
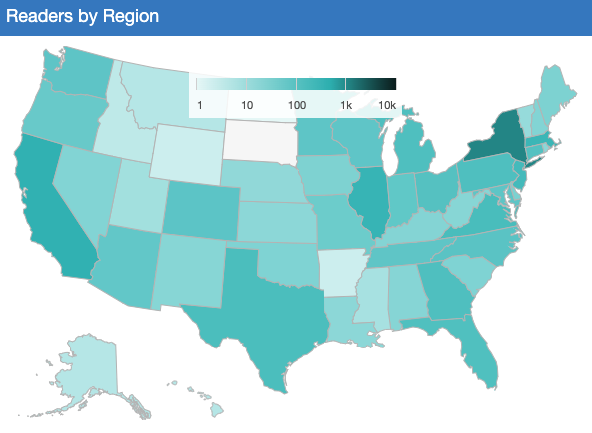
Readers by Region
This map shows where your readers are in the United States when accessing your documents in the date range selected. Hover over any state to see the number of readers in that state in the date range selected.
NOTE: For readers outside of the U.S., refer to the Regions table.
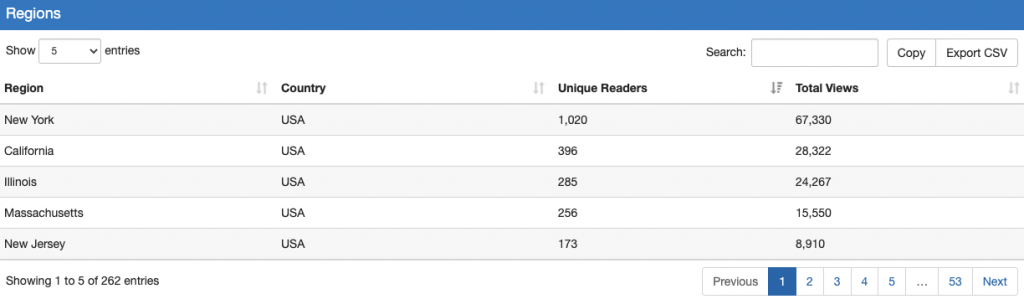
Regions
This table breaks down readers by state/region in the date range selected. This table will also show your readers accessing in all countries.
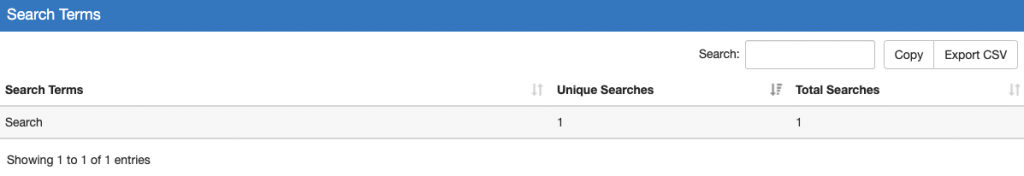
Search Terms
This table shows all terms searched for on your Digital Edition in the date range selected.
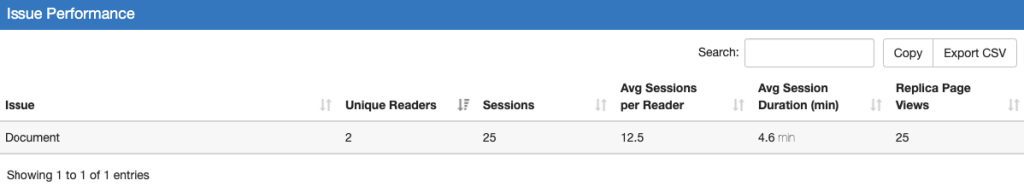
Document Performance
This table shows Unique Readers, Sessions, Average Sessions per Reader, Average Session Duration and Replica Page Views for each document viewed in the date range selected.
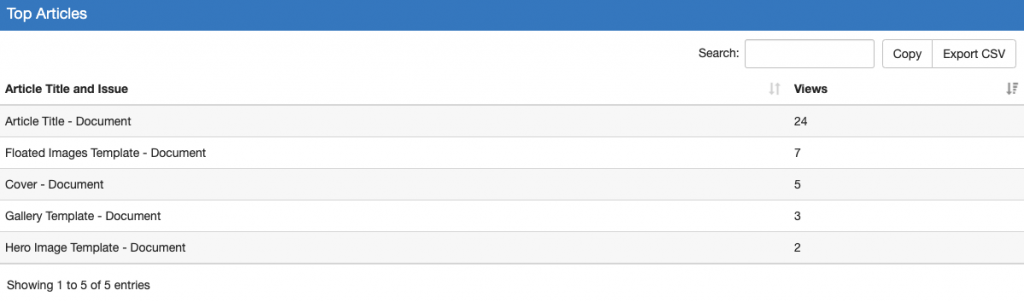
Top Articles
This table shows Views for the top viewed articles across all documents in the date range selected.
 Contact Support