
Key Performance Indicators
Article Performance
Replica Page Performance
Advertisement Performance
Link Clicks
Popup Performance
Regions
The Document Content tab is the only tab where you can find metrics on specific documents. There is an added dropdown menu at the top of the tab where you can select the document you wish to see metrics for.

Key Performance Indicators (KPIs)
In the KPI table, we break down the content by Articles, Pages, Other and All Content.
- Articles refer to the responsive articles, shown in Reading View.
- Pages refer to the physical pages digitized from your PDFs, shown in Page View.
- Other refers to all content that is not an article or page. For example, banner ads, TOC, Library page, etc.
- All Content will give you the total number for each column. Articles + Pages + Other will equal All Content for all columns, except for Unique Readers and Total Sessions.
The table below defines each metric within the KPI table on the Overview tab.
Definitions of KPI Metrics
| Metric | Definition | Calculation |
| Unique Readers | The number of unique readers that viewed a piece of content within the date range. A reader is determined to be unique based on cookies stored on their device. If possible, GTxcel will count a subscriber as one unique reader even if they access content from multiple different devices during the date range. | Unique ‘content viewed’ events |
| Total Views | The number of times a piece of content was viewed within the date range. A piece of content can be an article, a replica page, an interstitial advertisement, a table of contents, or a popup. | Total ‘content viewed’ events |
| Total Duration | The sum of the duration of all content views within the date range. | Total duration of ‘content viewed’ events |
| Total Sessions | The number of sessions that took place within the date range. A session is a group of interactions that take place within a period of time that starts when a reader views a piece of content and ends after 30 minutes of inactivity. | Total unique session IDs associated with at least one ‘content viewed’ event |
| Bounce Rate | The number of sessions that included only one content view as a percentage of all sessions during the date range. | (Total sessions containing just one content view / Total sessions) x 100 |
| Average Views per Reader | The average number of content views that each user viewed within the date range. | Total ‘content viewed’ events / Total Unique Readers |
| Average Duration per Reader | The average time that each user spent reading during the date range. | Total duration of ‘content viewed’ events / Total Unique Readers |
| Average Session Duration | The average duration of the all sessions that took place within the date range. | Total duration of ‘content viewed’ events / Total number of sessions |
| Shares | The number of times content was shared using the buttons provided during the date range. | Total ‘shared’ events |
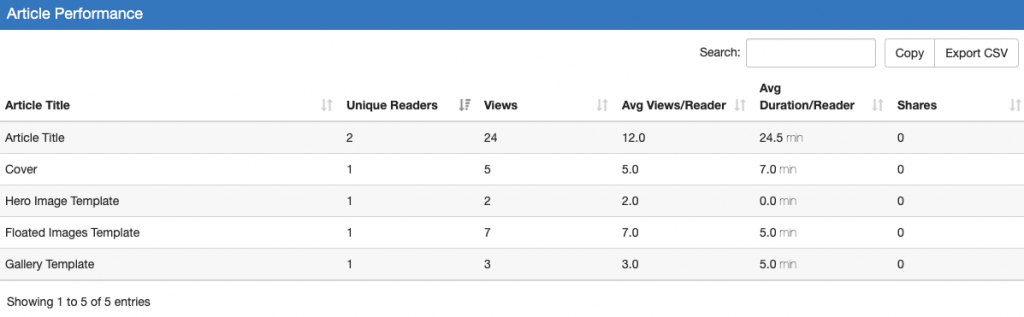
Article Performance
The Article Performance table will show you Unique Readers, Views, Average Views per Reader, Average Duration per Reader and Shares for each article (Reading View) in the document, date range and platform selected.
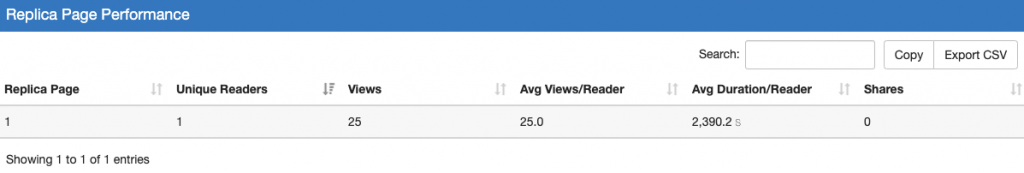
Replica Page Performance
The Replica Page Performance table will show you Unique Readers, Views, Average Views per Reader, Average Duration per Reader and Shares for each page (Page View) in the document, date range and platform selected.
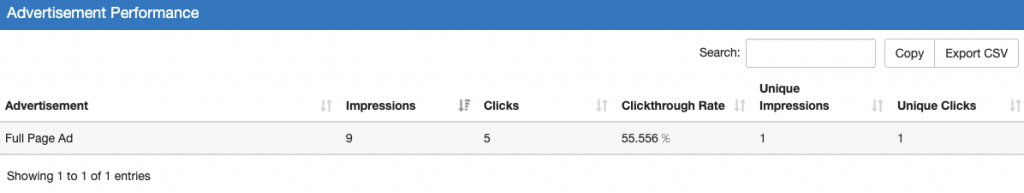
Advertisement Performance
The Advertisement Performance table shows you Impressions, Clicks, Clickthrough Rate, Unique Impressions and Unique Clicks for the Ads placed in the document, date range and platform selected.
NOTE: The advertisements shown in this table are Full Page and Fractional ads in the Articles (Reading View) and any ads placed in the UI (banner ads, TOC ads, etc.).
Advertisements on physical pages in the Page View will NOT appear in this table, you can find those metrics in the Replica Page Performance table.
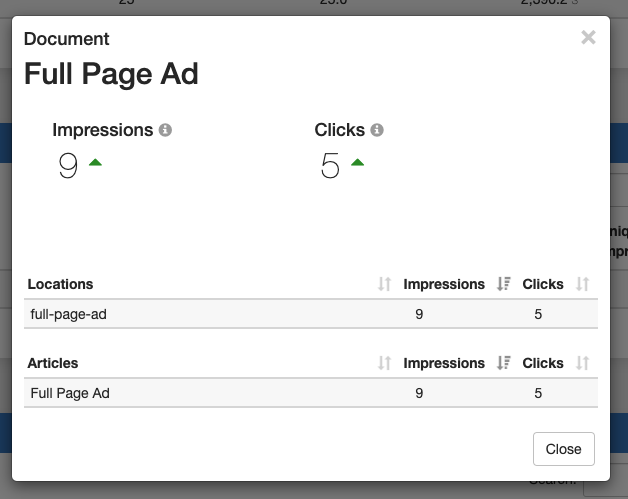
Clicking on one of the ad entries will populate a popup box giving you more info about where that ad is located and the break down.
Link Clicks
The Link Clicks table will show you Clicks and Unique Clicks for all placed links (Reading View and Page View) in the document, date range and platform selected.
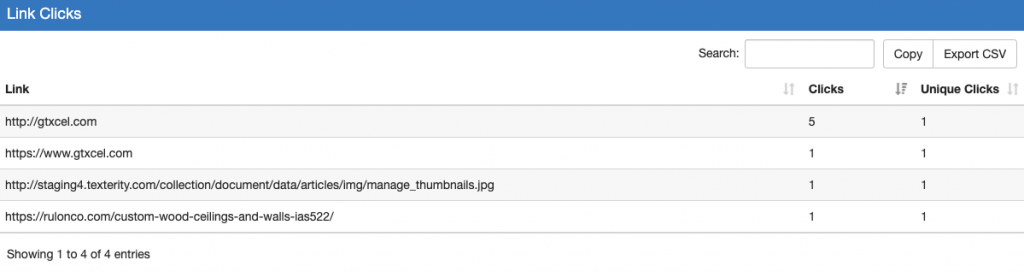
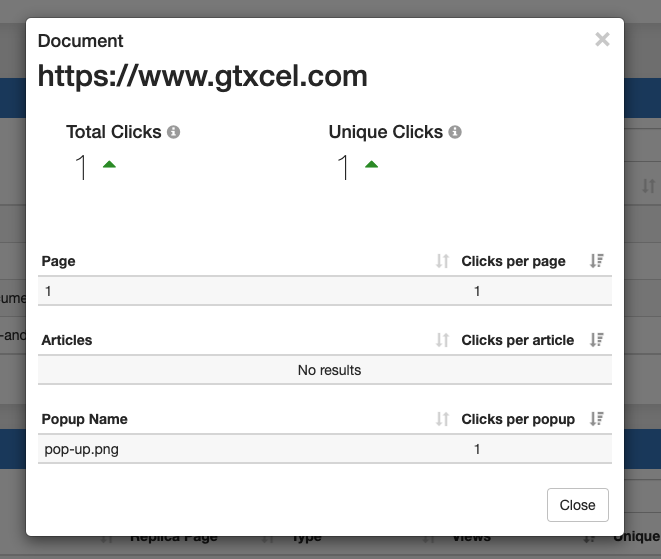
Clicking on one of the link entries will populate a popup box giving you more info about where that link is located and the break down if placed in multiple locations.
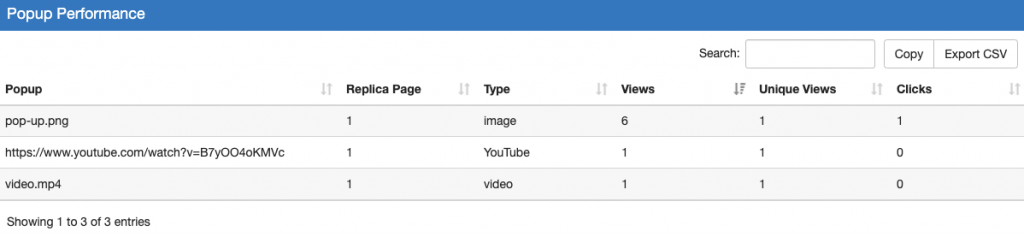
Popup Performance
The Popup Performance table shows you the Replica Page the popup is located, the Type of popup (image, gif, YouTube, Video, etc.), Views, Unique Views and Clicks in the document, date range and platform selected.
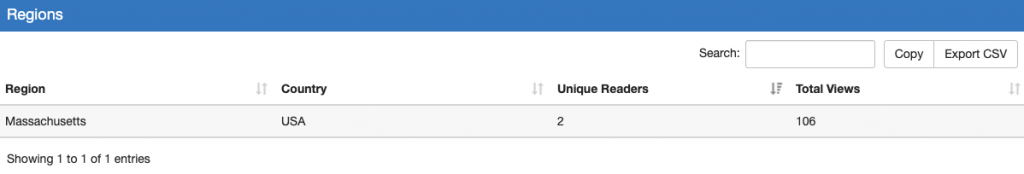
Regions
The Regions table shows Unique Readers and Total Views for each region a reader has accessed the selected document from, in the date range and platform selected.
 Contact Support